Quick Take
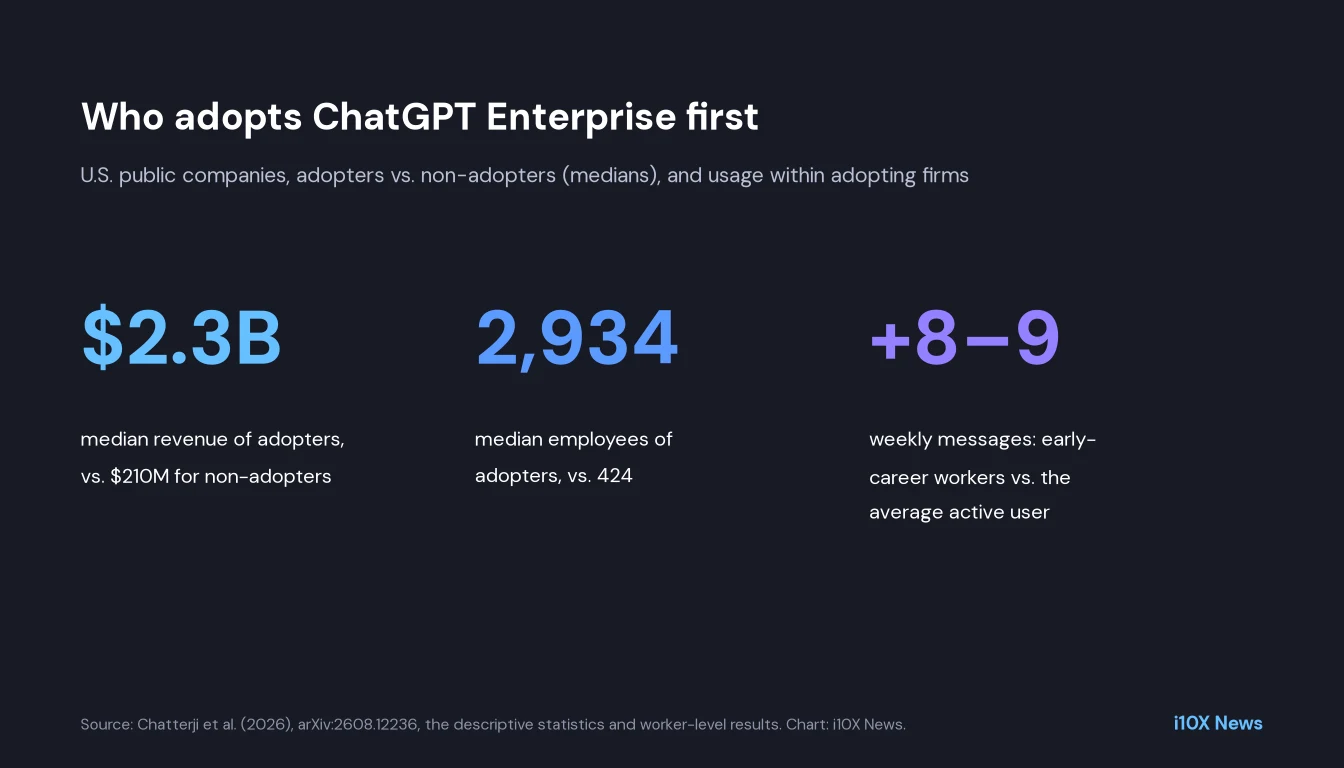
- The finding: Enterprise AI adoption is not spread evenly. U.S. public companies that adopted ChatGPT Enterprise had a median revenue of $2,275.1M, against $209.6M for non-adopters, and they are more R&D- and SG&A-intensive.
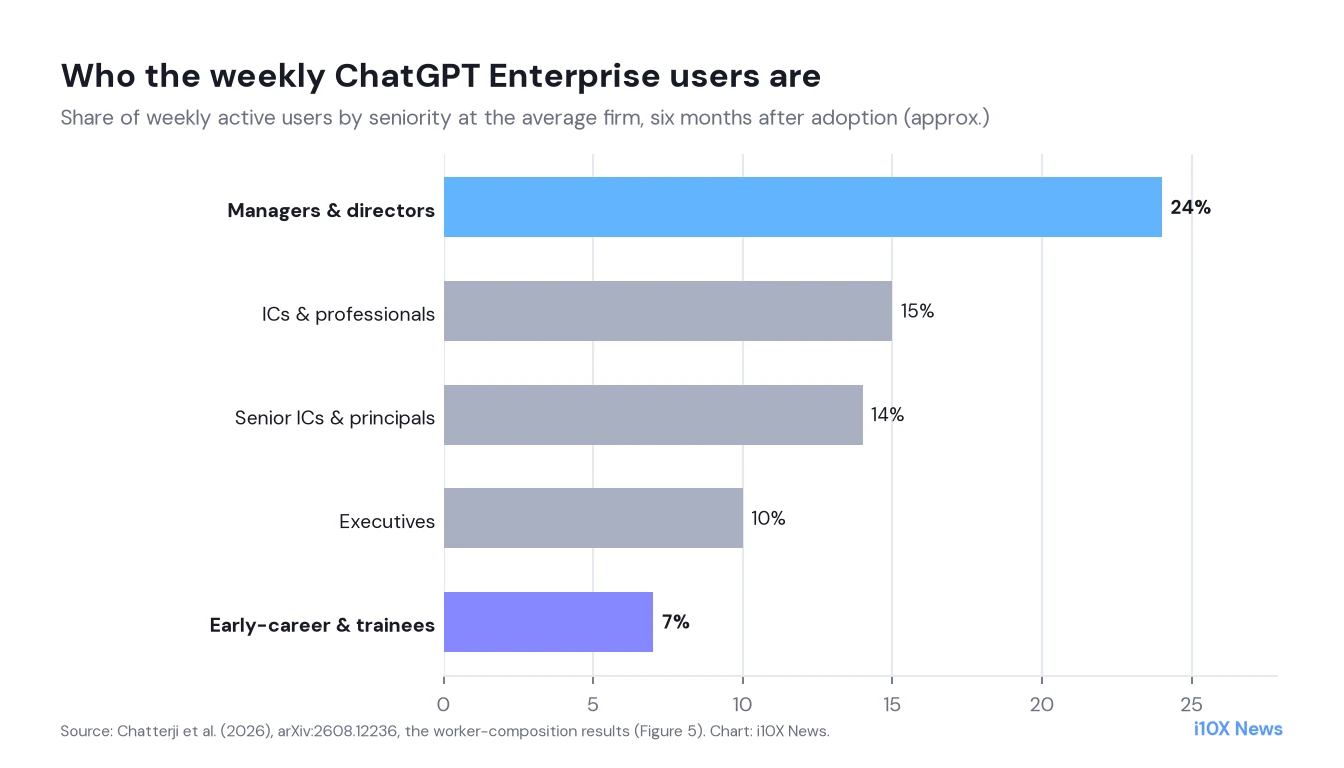
- Who uses it most: Managers and directors make up the largest share of weekly active users (about 24% at the average firm), but early-career workers and trainees send roughly eight to nine more messages per week than the average active user in their firm.
- What it means: Buying seats is the easy part. The paper concludes that firms are still learning how to fit AI into workflows, and that early diffusion may widen existing gaps between firms.
Most of what we know about workplace AI comes from surveys, which rely on people remembering and reporting their own use. This working paper, written by economists at OpenAI together with researchers from Columbia Business School and the Wharton School, uses administrative data instead: ChatGPT Enterprise account records linked to usage logs, inferred job titles, message-level task classifications and public-company financial data through March 2026. At the six-month adoption horizon, the worker-level sample covers more than 1,500 organizations and more than 17 million messages.
What the study shows
The authors document four facts. Enterprise usage has grown quickly, driven both by new firms signing up and by existing customers using it more. Adoption among U.S. public companies is concentrated among larger, more valuable and more intangible-intensive firms. Within adopting firms, use spans job functions and seniority levels. And the tasks cover a broad range of knowledge work.
| Median (U.S. public firms) | Adopters | Non-adopters |
|---|---|---|
| Revenue | $2,275.1M | $209.6M |
| Total assets | $4,394.2M | $667.6M |
| Employees | 2,934 | 424 |
| Market value | $4,997.2M | $316.4M |
| R&D expenses | $113.1M | $9.9M |
- Scale predicts adoption: A one-log-point increase in lagged revenue is associated with a 1.1 percentage point higher probability of adopting in a given fiscal year. Firms in the top 5% by revenue are 9.8 points more likely to adopt, and 11.3 points more likely when compared within their own industry and year.
- But bigger firms are not heavier users: Among adopters, lagged log employment is negatively associated with messages, weekly active users and output tokens per employee. Larger firms adopt earlier, but use is not more intense per employee.
- Engineers lead, but not by much: At the average firm, engineering and technical practitioners account for about 11% of weekly active users after six months, executives, founders and partners for 9%, finance and accounting and marketing and communications for about 5% each.
- Heavy users sit lower in the hierarchy: Analysts and marketing and communications staff send more weekly messages than the average active user, and early-career workers send roughly eight to nine more, while managers, directors and executives send fewer.
- Writing dominates: Documentation and technical writing, technical digital work and communication are among the most common tasks in every major industry group.
Why it matters: data instead of self-reports
Surveys capture non-users and barriers, but self-reported usage is less detailed and can be biased. Logs show who actually sends messages and for what. The result is a more nuanced picture than headline adoption rates: the same tool, rolled out across a company, ends up used very differently across teams and career levels.
The early-career finding is especially relevant to the current debate about AI and junior jobs. The authors note it identifies early-career workers as particularly intensive users, conditional on active use, which matters for interpreting recent evidence on AI and entry-level labor-market outcomes.
Method in brief
The authors link ChatGPT Enterprise accounts to Compustat financial data via a ticker bridge and estimate linear probability models of first adoption in a fiscal year (2024–2025), with industry and year fixed effects. Usage intensity is measured as weekly messages, output tokens and weekly active users per employee. Job titles are classified into job title classes and seniority levels, and messages are assigned to task categories with privacy-preserving automated classification. Worker-level results are measured six months after an organization adopted.
What remains open
- Correlation, not cause: The financial results are associations. They show which firms adopt first, not that adoption raises revenue or productivity.
- One product, one vendor: The data only cover ChatGPT Enterprise. Firms that use other assistants, consumer accounts or API products are invisible, so this is not a market-wide adoption rate.
- User shares are not adoption rates: The authors stress that worker-composition results measure each group’s share of active users, not the share of employees in that group who use the tool.
- Conflicts of interest: Three authors are OpenAI employees, and the two academic authors contributed as paid contractors for OpenAI. The paper is a working paper and results are subject to change.
Context
The paper extends earlier OpenAI research on consumer ChatGPT use and joins a fast-growing literature on generative AI as a general purpose technology. Its key message, that firms must discover use cases and redesign workflows rather than just buy access, echoes findings on earlier technologies such as IT and electricity. More on enterprise AI adoption sits in our Society & Economy research and on the OpenAI hub.
What it means for companies rolling out AI
- Track use, not seats: Adoption inside firms is uneven. Measure who is active and how often, by function and seniority.
- Look at junior staff: Early-career employees are the heaviest users. Training, review processes and quality checks should be built around them.
- Expect writing first: Documentation, communication and technical work are the common starting points across industries, so they are good places to standardize prompts and review.
- Plan for complements: The link between adoption and intangible investment suggests that data, processes and skills determine how much value a rollout delivers.
About the analysis
Researched and written with AI assistance under the editorial responsibility of the i10X News team. The title image is an AI-generated illustration. Read our AI Use Policy. Spotted an error? Request a correction.
This article is based on the full text of the preprint “How Organizations Use AI: Evidence from ChatGPT” (arXiv:2608.12236v1, submitted August 12, 2026). All numbers are taken from the paper’s text, tables and figures; i10X did not rerun the experiments. The paper is distributed under arXiv’s non-exclusive license, so i10X does not reproduce its figures; the charts were drawn by i10X from numbers reported in the descriptive statistics and worker-level results and the worker-composition results (Figure 5).
i10x Perspective
This is the most detailed look yet at enterprise AI from the inside, and the conclusion is sobering for anyone selling seats: access does not equal use. The firms that move first are already the biggest and most intangible-rich, which means generative AI may, at least initially, widen rather than narrow the gap between leaders and laggards. The early-career pattern deserves attention too. If juniors are the most intensive users, they are also the group whose work, and training, is changing fastest. Keep the vendor authorship in mind, but the data themselves are hard to get any other way.